


|
|
|
|
| Dataset examples |
Below some examples are given of dataset manipulations. Use is made of the PRTools command genlab(N) that generates a set of numeric labels, N(i) for class i. The command scatterd is similar but not identical to the Matlab command scatter and has thereby a similar, slightly different name.
% delete all figure
delfigs
% reset random seed for repeatability
% randreset(1)
% Generate in 2 dimensions 3 normally distributed classes of 20 objects each
a = dataset(randn(60,2),genlab([20 20 20]))
% 60 by 2 dataset with 3 classes: [20 20 20]
% Give the features a name
a = setfeatlab(a,char('size','intensity'))
% 60 by 2 dataset with 3 classes: [20 20 20]
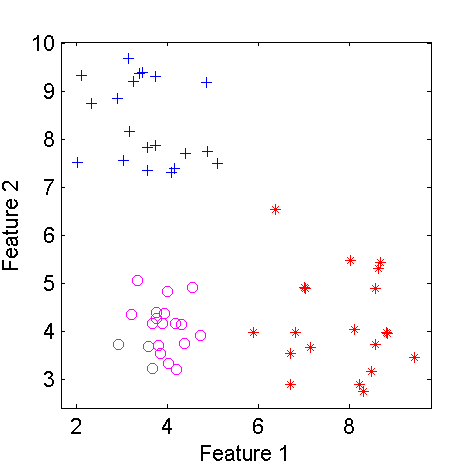
% Make the distributions of the classes different and plot them
a(1:20,:) = a(1:20,:)*0.5;
a(21:40,1) = a(21:40,1)+4;
a(41:60,2) = a(41:60,2)+4;
figure; scatterd(a)
% create a subset of the second class
b = a(21:40,:)
% 20 by 2 dataset with 3 classes: [0 20 0]
% add 4 to the second feature of this class
b(:,2) = b(:,2) + 4*ones(20,1)
% 20 by 2 dataset with 3 classes: [0 20 0]
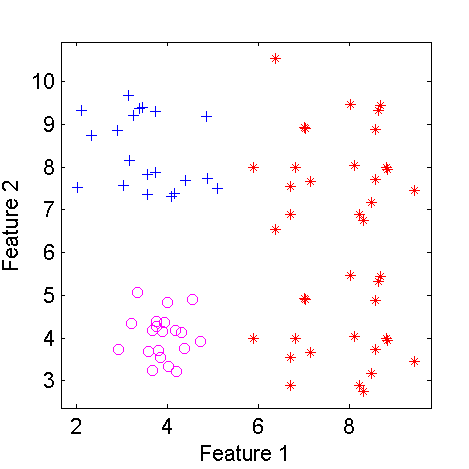
% concatenate this set to the original dataset
c = [a;b]
% 80 by 2 dataset with 3 classes: [20 40 20]
figure; scatterd(c);
showfigs
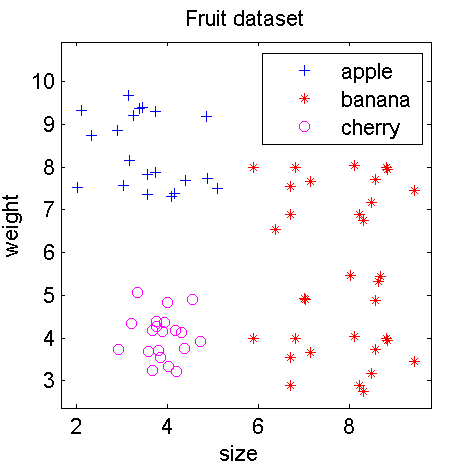
For better annotation of the plot we may add some information on the dataset, the classes and features in some recognizable way, e.g.
    c = setname(c,'Fruit dataset');
    c = setlablist(c,char('apple','banana','cherry'));
    c = setfeatlab(c,char('size','weight'));
    figure; scatterd(c)
R.P.W. Duin
, January 28, 2013|
|
|
|
| Dataset examples |